Q. Define Community with examples? (Two marks)
- Ans. A functional unit of mutually interacting populations of animals, plants, and microorganisms in a given area at a given time”. A community is a group of organisms in the same environment that interact with one another. These interactions can be positive, negative, or neutral (have no effect) and can greatly impact the ecosystem the organisms live in. It also has an effect on their niches.
- example. A forest, a pond and a desert are natural communities.
Q. Enlist the major characteristics of a community ecology ((Two marks)
Ans.
(a)Species Diversity
(b) Growth From and structure
(c) Dominance
(d) Succession
(e) Self reliance
(f) Relative abundance
(g) Tropic structure.
Q. Explain in detail all seven characteristics of a community ecology (5 marks)
- Species Diversity:
- Each community consists of different organisms like plants, animals, microbes etc. They differ taxonomically from each other. This species diversity may be regional or local.
- Regional diversity: whole nations or parts of continents within which many different communities exist
- Local diversity: in a given nation where different communities exist at different latitudes.
2. Growth From and structure:
- Community can be analysed ‘ in terms of major growth forms like trees, shrubs, herbs etc. In each growth from as in trees, there may be different kinds of plants as-broad leave trees, evergreen trees etc. These different growth forms determine the structural pattern of a community.
- According to mode of arrangement of various growth forms the communities exhibit the structures like
- 1. zonation-horizontal layering
- 2. Stratification (vertical layering) : Arrangement of different species in a community in vertical layers
3. Dominance:
- All species are not equally important in each community. The nature of the community is determined by a few species in a community. These limited species have control and dominating influence in the community. Such species are known as dominants
- Eg. A vast sal or teak forest is a dominant community
4. Succession:
- Each community develops as a result of directional changes in it over time until it has reached the climax stage (like a mature forest- is reached or until a disturbance like a fire).
5. Self reliance:
- Each community has a group of autotrophic plants as well as heterotrophic animals. The autotrophic plants are self dependent. This exhibits a perfectly balanced assemblage of organisms
6. Relative abundance:
- Different populations in a community exist in relative proportions and this idea is called as relative abundance.
7. Trophic structure:
- Each community has a trophic structure that determines the flow of energy and material from plants to herbivores to carnivores. This maintained the abundance of organisms.
Q. Enlist the characters that are used to study the structure of community (one mark)
ANS. ANALYTICAL CHARACTERS and SYNTHETIC CHARACTERS
Q. Describe the Analytical characters (only Quantitative characters) of community (5 marks)
Ans. Analytical characters are those features of the community which can be observed or measured directly in each stand. They include kinds and number of species, distribution of individuals, species vitality, form, number of individuals, height of plants, area volume, growth rate and periodicity, etc.
•There are two different aspects of ANALYTICAL CHARACTERS –
1.Quantitative characters which can be measured and 2. Qualitative characters which are described and not measured
Quantitative characters include
- Frequency
- Density
- Abundance
- Cover
- Basal area
•In the community the individuals of all the species are not evenly distributed. individuals of some species are widely spaced while those of some other species are found in clumps or mats. The distribution pattern of individuals of different species indicate their reproductive capacity as well as the environment. Frequency refers to the degree of dispersion in terms of percentage occurrence. It is determined with the help of following formula:
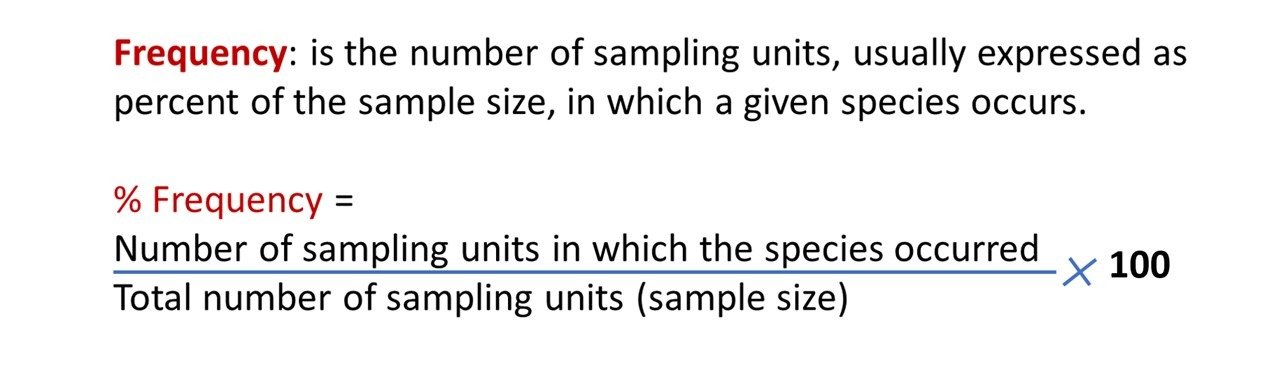
After determining the percentage frequency of each species, various species are distributed among Raunkiaer’s (1934) five frequency classes depending upon their frequency values as follows:
| Frequency class | Frequency class |
| A | 1-20 |
| B | 21-40 |
| C | 41-60 |
| D | 61-80 |
| E | 81-100 |
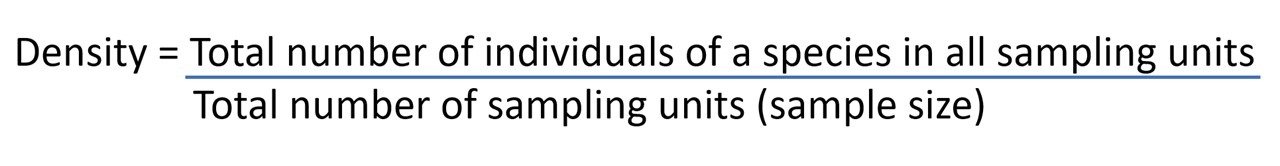
Density: It represents the numerical strength of a species in whole habitat. The mean number of the individuals of a species per sampling unit is its density.
Abundance:
This is the number of individuals of any species per sampling unit of occurrence. It is calculated as

Cover and basal area:
Cover: The area of ground occupied by the above ground parts of the plant (like stem, leaves, inflorescence) as viewed from the top. It is a good measure of herbage availability. It is estimated by chart-quadrate, line-intercept or point frame.
Basal area: Ground actually penetrated by the stem or trunk. It is measured either 2.5 cm above ground or actually on the ground level. It is measured by callipers, line-interception or point-centered quadrat method.
Cover classes: Based on their cover values, the species of a community are assigned to following SIX groups/cover classes:
(1) Group I > 5% (2) Group II 5-25% (3) Group III 25-50% (4) Group IV 50-75% (5) Group V 75-95% (6) Group VI 95-100%
Dominance: Infact Dominance is a synthetic character. However, Daubenmire (1959) considered it as a analytical character and expressed its six types. Infact, the number of organisms may not give the correct idea of the species. If we base our conclusion on number, a single or few trees in a grassland, or a few grasses in a forest should be of little value. But if we consider the species on the basis of area occupied or weight (biomass), the situation may be different. So, Thus in dominance, cover is included as important character. The single tree in grassland may occupy fairly a large area and may have much mass.
Q. Describe Qualitative characters from Analytical characters of Community. (5 marks)
1. Physiognomy: In community ecology physiognomy refers to the appearance of vegetation on the basis of the growth form of dominant species. For example vegetation dominated by trees and shrubs is a forest. Similarly grassland, desert etc.
2. Phenology: Calendar of events in the life history of plant species. Phenology of a species is depicted by a phenogram.

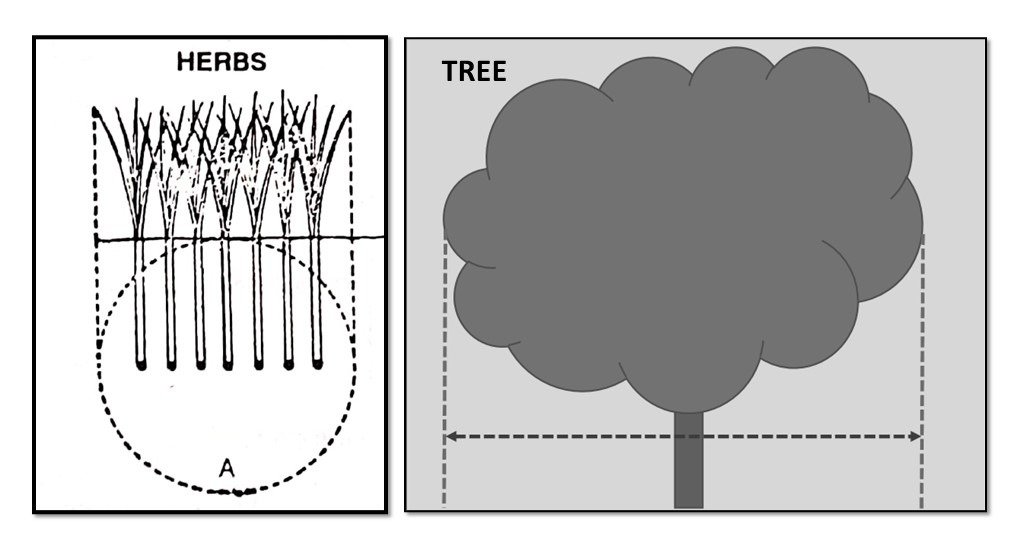
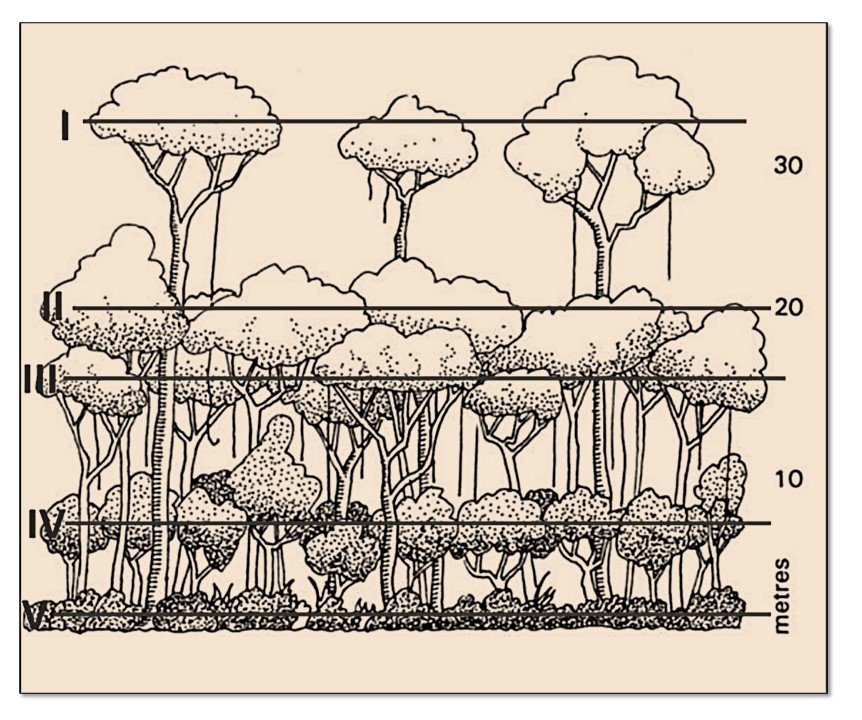
Stratification: The plants of different species are arranged in different vertical layers in order to make full use of the available physical and physiological requirements.
•On the basis of general observation a number of layers have been distinguished as
- L1 — ground stratum like mosses, thallophytes, lichens, etc.
- L2 – herbaceous or ground flora
- L3 — middle layer or shrubby layer
- L4 – top layer or canopy layer of trees
Abundance: The estimated number of individuals of a species per unit area is referred to as abundance. It can not be expressed generally in quantitative terms. The plants are not found uniformly distributed in an area. Depending upon the number of plants they are divided into five arbitrary groups:
- Very rare
- Rare
- Common
- Frequent
- Very much frequent
Sociability: Individuals of some species grow widely spaced while those of some species are found in clumps or mats. The space relationship of plants is referred to as sociability. Braun Blaquet (1953) has recognized five sociability classes:
- S1 = Plants grow singly
- S2 = A group of 4-6 individuals at one place
- S3 = Many smaller scattered groups at one place.
- S4 = Several bigger groups of many plants at one place.
- S5 = A large group occupying a large area.
6. Vitality: this is the capacity of normal growth and reproduction which are important for successful survival of a species. Daubenmire (1968) recognised five vitality groups.
- V1 Species whose seedling die.
- V2 Seedlings grow but do not reproduce.
- V3 Reproduction only vegetative.
- V4 Reproduction sexual but not regularly.
- V5 Growth normal and sexual reproduction regular.
Life form: A Life form is “the sum of the adaptation of the plant to climate” on the basis of the position of perennating buds on plants and the degree of their protection during adverse condition, Raunkiaer classified plants into five categories:
Phanerophytes: Their buds are situated high upon the plant. It includes trees, shrubs, climbers. Depending upon the size they may be further subdivided into
- Mega-phanerophtes- over 30 m high
- Meso-phanerophytes- 8 to 30 m high
- Micro-phanerophytes- 2 to 8 m high
- Nano-phanerophytes- under 2 m
Chamaephytes: their buds are situated close to the ground surface. Eg. Trifolium repens
Hemicryptophytes: Their buds are hidden under soil surface, protected by the soil itself. Their shoots generally die each year. Eg. Biennial and perennial herbs
Cryptophytes or Geophytes: Their buds are completely hidden in the soil as bulbs and rhizomes. Eg. Hydrophytes – their buds are found below the water surface
Therophytes: They complete their life cycle in a single favourable season, and remain dormant through-out the rest unfavourable period of the year in the form of seeds. Eg. Desert plants
Raunkiaer (1935) made an extensive study of world flora and prepared a ‘Normal Biological Spectrum’ as follows:
- Phanerophytes- 46%
- Chamaephytes- 09%
- Hemicryptophytes- 26%
- Cryptophytes or Geophytes- 06%
- Therophytes- 13%
Q. Explain the Synthetic characters of Community. (3 marks)
ANS 1. Presence and Constance: This is the extent of occurrence of a particular species in a community, i.e. how uniformly a species occurs in the same type of community. A species may be assigned to any of the five presence classes:
- Rare species Present in 1-20% of sampling units
- Seldom species present in 21-40% of sampling units
- Often species present in 41-60% of sampling units
- Mostly species present in 61-80% of sampling units
- Constantly species present in 81-100% of sampling units
2. Fidelity: The quality of being faithful. An estimate of the degree with which a species is restricted in distribution to one kind of community.
- Fidelity -1– Plants appearing accidentally
- Fidelity-2– Indifferent plants, may occur in any community
- Fidelity-3 –Occur in many communities, but predominant in only one (Preferent)
- Fidelity-4– Specially present in one community but may occasionally in other communities (Selective).
- Fidelity-5– Occur only in one particular community, never in others (exclusive)
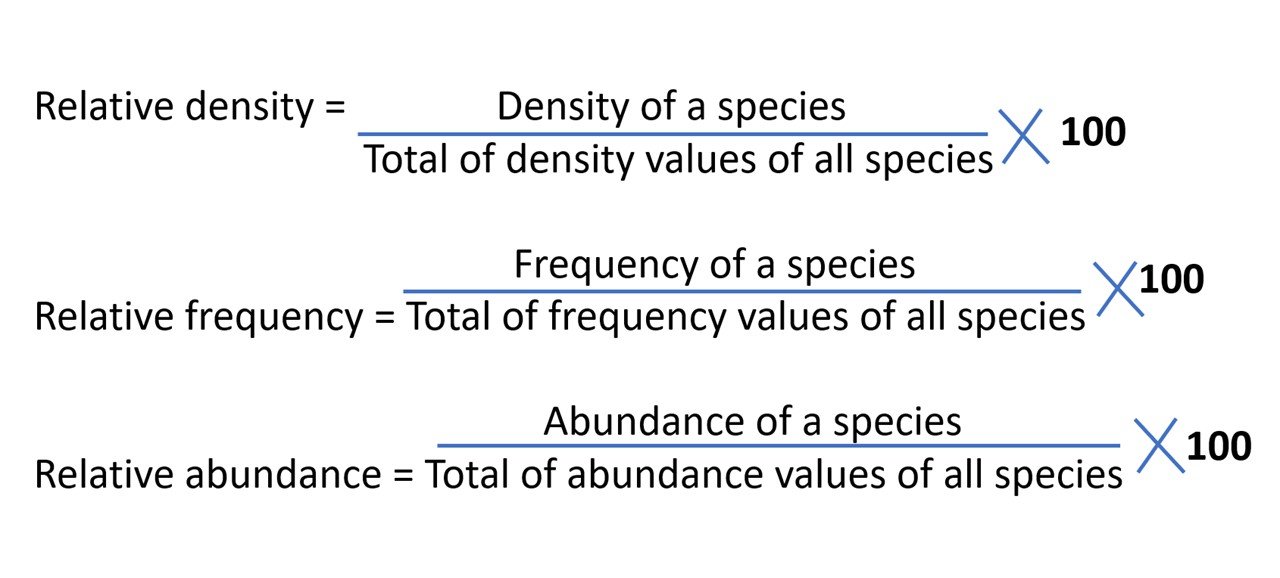
3. Importance value index (IVI) : This index is used to determine the overall importance of each species in the community structure. Importance value index (IVI) is a good measure of the relative importance of a species in a community. Importance value index (IVI) = Relative density (RD) + Relative frequency (RF) + Relative abundance (RA).
Other synthetic characters: Besides these other synthetic characters include interspecific association, association index, index of similarity, dominance index, diversity index, etc. These have been quite useful in comparative studies of communities.
Thank you for the sensible critique. Me & my neighbor were just preparing to do some research on this. We got a grab a book from our area library but I think I learned more clear from this post. I am very glad to see such great info being shared freely out there.
Glad to be one of several visitors on this awe inspiring internet site : D.
It?¦s really a nice and helpful piece of info. I am glad that you simply shared this useful info with us. Please keep us informed like this. Thank you for sharing.
Thanks and i will check for the compatibility mode of the blog
I am currently writing a paper and a bug appeared in the paper. I found what I wanted from your article. Thank you very much. Your article gave me a lot of inspiration. But hope you can explain your point in more detail because I have some questions, thank you. 20bet
Keep up the excellent work!
thanks
Sure!